For windows target, just click on the AADLInspector icon one the tool
is installed.
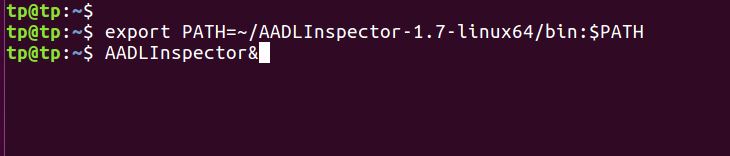
For Linux, we assume AADLInspector is installed in your home, in a folder
called AADLInspector-1.7-linux64,
whic means that you have installed the version 1.7 of the tool.
To launch the tool, update your shell PATH variable to point to
the bin
folder of AADLInspector, and then AADLInspector can be called
as any shell command,
as shown above.
Save those files in a specific folder.
Those files are composing an AADLInspector project: the file .aic allows
AADLInspector to load all AADL files composing your model from the
menu File/Load entry. Those files constitute what we call the declaratie model,
types that are possibly reused in other models.
From the File/Load menu entry, load the project.
With the "Static Analysis, Parse and Instanciante" LMP button,
verify the AADL model. This menu entry also generates the instance model,
the list of components on which we can run scheduling verification.
Declarative models cannot be used to perform scheduling analysis. What
is the root component of this instance model? Give the complete instance model graph.
To perform a scheduling analysis, the processor component has to be
extended with few properties. Add to the cpu_leon2 component the following properties:
Compute the scheduling of this thread set with Cheddar by the
button Timing Analysis/Simulation timelines (Cheddar). From this simulation,
compute with Cheddar the response times of the threads by the button Simulation
Tests (Cheddar).
Compute theoretical worst case thread response times, always with Cheddar
but with the button Timing Analysis/Theoretical Tests (Cheddar).
Open the task response thread summary panel.
Do a simulation with Marzhin.
Explain why we have different response times for each thread on this panel?
Update the Scheduling_protocol property for subcomponent cpu with
value "posix_1003_highest_priority_first_protocol"